랜덤포레스트 개념, 선언 (RandomForestRegressor()) 랜덤 포레스트는 여러 개의 의사결정나무를 만들어서 이들의 평균으로 예측의 성능을 높이는 방법이며, 이러한 기법을 앙상블 기법이라고 한다. 주어진 하나의 데이터로부터 여러 개의 랜덤 데이터셋을 추출해서, 각 데이터셋을 통해 모델을 여러개 만들 수 있따. from sklearn.ensemble import RandomForestRegressor model=RandomForestRegressor() 빅데이터 관련 자료/Dacon 2021.08.05
결측치 대체 보간법 결측치들을 평균값으로 대체하였으면, 이번에는 피쳐의 정보성을 강조하기 위해 보간보를 사용해서 결측치를 채우는 방법도 있다. 데이터에 따라서 결측치를 어떻게 대체할지 결정하는 것은 엔지니어의 결정이다. Python pandas의 interpolate() method를 사용해 구현하면 다음과 같다. df.interpolate(inplace=True) 빅데이터 관련 자료/Dacon 2021.08.04
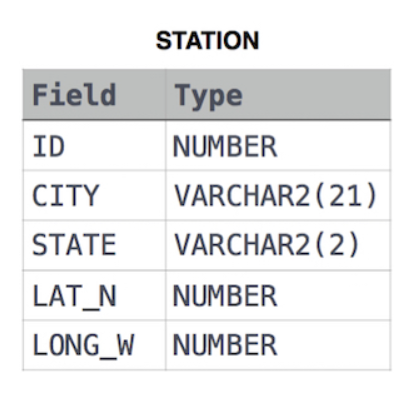
Weather Observation Station 6 Query the list of CITY names starting with vowels (i.e., a, e, i, o, or u) from STATION. Your result cannot contain duplicates. Input Format The STATION table is described as follows: # 나의 해답 SELECT CITY FROM STATION WHERE (SUBSTR(CITY,1,1) = 'A' or SUBSTR(CITY,1,1) = 'E' or SUBSTR(CITY,1,1) = 'I' or SUBSTR(CITY,1,1) = 'O' or SUBSTR(CITY,1,1) = 'U' ); 빅데이터 관련 자료/[SQL] Basic 2021.08.04
Weather Observation Station 5 Query the two cities in STATION with the shortest and longest CITY names, as well as their respective lengths (i.e.: number of characters in the name). If there is more than one smallest or largest city, choose the one that comes first when ordered alphabetically. The STATION table is described as follows: # 나의 해답 select * from (select city c, length(city) l from station order by l desc, c asc) .. 빅데이터 관련 자료/[SQL] Basic 2021.08.03
Lv2 | 전처리 | 결측치 평균으로 대체 (fillna({mean})) lv1에서 결측치들을 0으로 대체하였다. 하지만, 보다 나은 모델 성능을 위해서 결측치를 대체하는 방법은 여러가지 있다. 이번에는 각 피쳐의 평균값으로 대체해보겠다. 원하는 피쳐의 결측치를 해당 피쳐의 평균값으로 대체한다. df.fillna({'칼럼명':int(df['칼럼명'].mean)},implace=True) 결측치를 갖는 피쳐들을 탐색하고, 해당 피쳐들을 대체하고 나서, 결측치가 남아있는지 확인본다. df.isnull().sum() 빅데이터 관련 자료/Dacon 2021.08.03
Lv1 | 모델링 | 제출파일생성(to_csv()) 훈련시킨 모델로 테스트 파일을 예측하면 예측결과를 제출할 csv 파일을 만들어본다. 1. 백지의 답안지인 submission.csv 파일을 df 파일로 불러와서 예측결과를 덧입히기 2. 덧입혀준 df 파일을 csv 파일로 내보내기 3. 드라이브에 저장된 csv 파일을 다운받아 제출 빅데이터 관련 자료/Dacon 2021.08.02
Weather Observation Station 4 Find the difference between the total number of CITY entries in the table and the number of distinct CITY entries in the table. The STATION table is described as follows: # 나의 해답 SELECT COUNT(*)-COUNT(DISTINCT(CITY)) FROM STATION 빅데이터 관련 자료/[SQL] Basic 2021.08.02
파이썬 기초 - 6 필요한 라이브러리 불러오기 import pandas as pd import numpy as np import matplotlib.pyplot as plt import seaborn as sns 필요한 데이터셋 불러오기 df=sns.load_dataset("mpg") df.shape # (398,9) 데이터셋 일부만 가져오기 df.head() 데이터 요약하기 df.info() 결측치 보기 df.isnull().sum() 기술 통계 보기 df.describe() 범주형일 경우 include를 사용해 볼 수 있다. df.describe(include="object") 수치형 변수 보기 수치형 변수 mpg의 unique 값 보기 df.nunique() hist()를 통해 전체 수치변수에 대한 히스토그램을 그려본.. 빅데이터 관련 자료/Python 2021.08.02
Weather Observation Station 3 Query a list of CITY names from STATION for cities that have an even ID number. Print the results in any order, but exclude duplicates from the answer. The STATION table is described as follows: # 나의 해답 SELECT DISTINCT(CITY) FROM STATION WHERE MOD(ID,2)=0; 빅데이터 관련 자료/[SQL] Basic 2021.08.01
테스트예측(predict()) 테스트 파일을 훈련된 모델로 예측해본다. 훈련된 모델에서 predict() 매서드에 예측하고자 하는 data를 인자로 넣어주게 되면 해당 결과 array를 할당할 수 있다. [할당할 array]= model.predict(test) 빅데이터 관련 자료/Dacon 2021.08.01