320x100
시각화 도구: seaborn
필요한 라이브러리 불러오기
import pandas as pd
import seaborn as sns
import numpy as np
필요한 데이터셋 불러오기
df=sns.load_dataset("anscombe") #씨본에서 제공하는 데이터, pd.read_csv("https://raw.githubusercontent.com/mwaskom/seaborn-data/master/anscombe.csv") 똑같음
df.shape #(44, 3)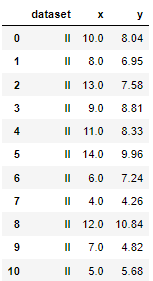
df_1,2,3,4, 만들기
df_1=df[df["dataset"]=='I']
df_1.describe()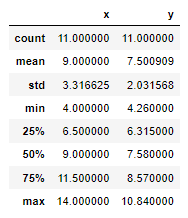
df_1.corr()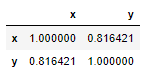
df_2,3,4도 똑같이 생성하면 된다.
series 빈도수 구하기
- value_counts()
df["dataset"].value_counts()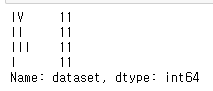
25%씩 분포로 나눈다.
df["dataset"].value_counts(normalize=True)*100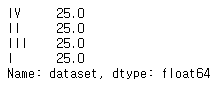
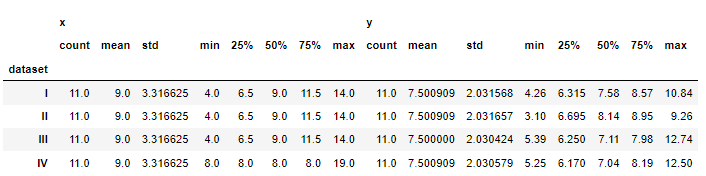
- groupby()
a=df.groupby("dataset")[["x","y"]].describe()
a
df.groupby("dataset")["y"].agg(["mean","std"])
countplot 시각화
sns.countplot(data=df,x="dataset")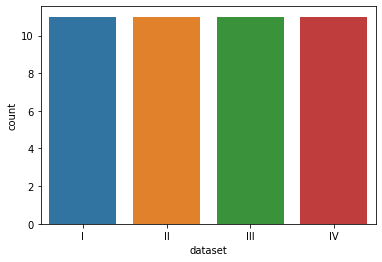
df["dataset"].value_countscounts() #위 그래프랑 같음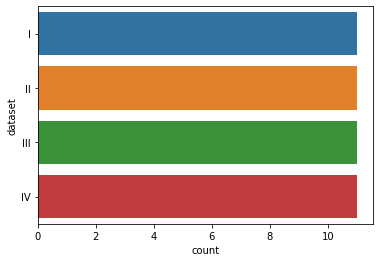
barplot 시각화
sns.barplot(data=df,x="dataset",y="x",ci="sd",estimator=np.sum) #ci는 신뢰수준, (기본값:평균 ,np.sum:합계)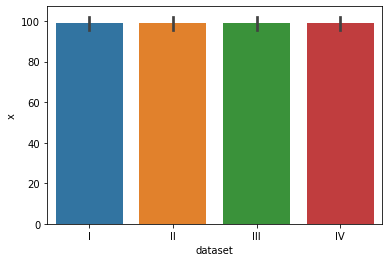
boxplot 시각화
#범위를 알고싶다면
sns.boxplot(data=df,x="dataset",y="x") #다이아몬드 이상치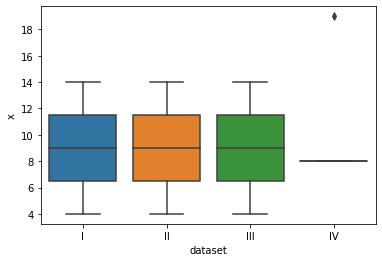
violinplot 시각화
#범위를 알고싶다면
sns.violinplot(data=df,x="dataset",y="x")
violinplot 시각화
#범위를 알고싶다면
sns.violinplot(data=df,x="dataset",y="y")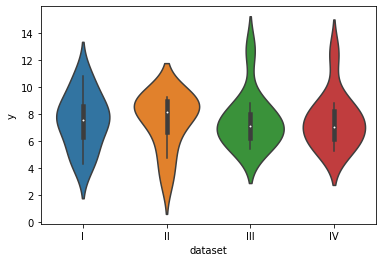
scatterplot 시각화
sns.scatterplot(data=df,x="x",y="y",hue="dataset") #hue색상별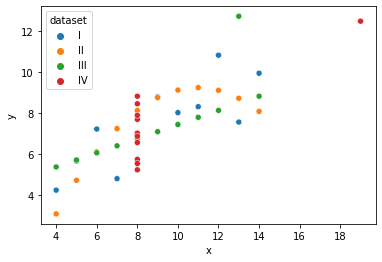
regplot 시각화
sns.regplot(data=df,x="x",y="y") #회귀선, hue 대부분 지원하는데 이것만 지원하지않아
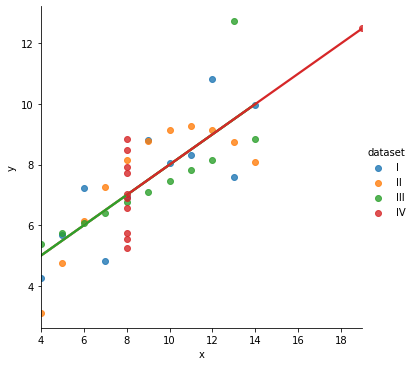
lmplot 시각화
sns.lmplot(data=df,x="x",y="y",hue="dataset")
신뢰수준 제거 후 시각화하였다.
sns.lmplot(data=df,x="x",y="y",hue="dataset",ci=None)
sns.lmplot(data=df,x="x",y="y",hue="dataset",ci=None,col="dataset")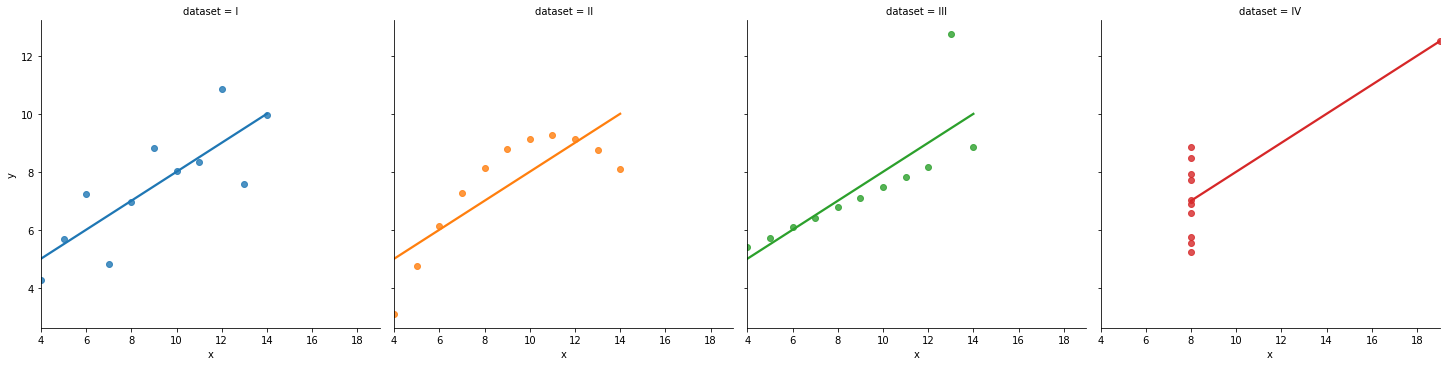
col=2로 하면 2열로 따로 그려준다.
sns.lmplot(data=df,x="x",y="y",hue="dataset",ci=None,col="dataset",col_wrap=2)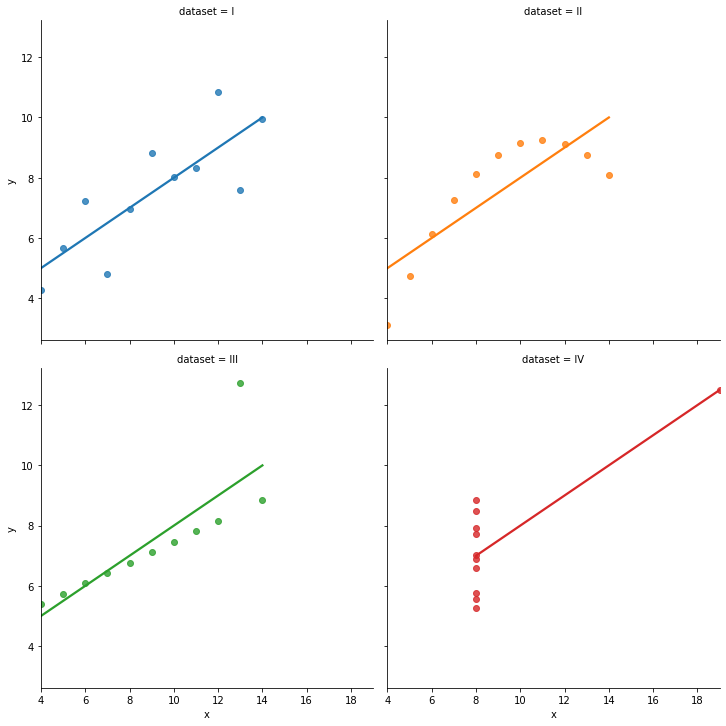
#데이터 describe값이 같더라도 시각화를 해보면 다르다. 시각화의 중요성! (https://www.autodesk.com/research/publications/same-stats-different-graphs)
320x100
320x100
'빅데이터 관련 자료 > Python' 카테고리의 다른 글
| index_col, 원하는 컬럼을 인덱스로 지정하여 불러오기 (0) | 2021.10.25 |
|---|---|
| 파이썬 기초 - 6 (0) | 2021.08.02 |
| 파이썬 기초 - 4 (0) | 2021.07.26 |
| 파이썬 기초-3 (0) | 2021.07.22 |
| 파이썬 기초 - 2 (0) | 2021.07.21 |